The 2.6.31 Linux kernel will add a new performance counter subsystem called Performance Counters for Linux (or perfcounters for short). To use perfcounters, build a kernel with:
CONFIG_PERF_COUNTERS=y
You will need elfutils and optionally binutils (for c++ function unmangling). On debian or ubuntu:
apt-get install libelf-dev binutils-dev
The tools must be built 64bit on a 64bit kernel. If you have a mixed 64bit kernel/32bit userspace (like some amd64 and ppc64 distros) then build a 64bit version of elfutils. I usually don’t bother building the optional 64bit binutils in this case and just put up with mangled c++ names (hint: feed them into c++filt to demangle them). Now build the perf tool:
# cd tools/perf
# make
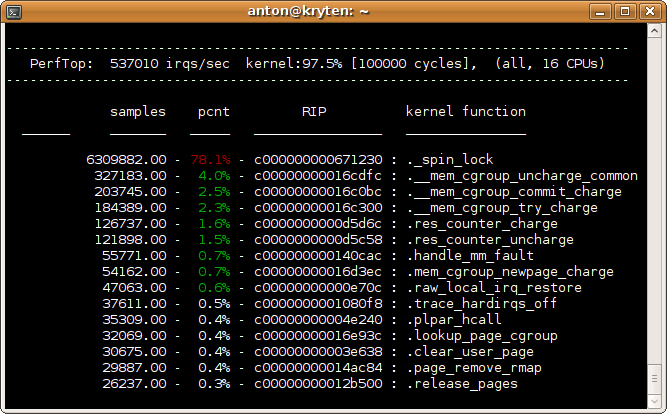
Now we can use the tools to debug a performance issue I was seeing in 2.6.31. A simple page fault microbenchmark was showing scalability issues when running multiple copies at once. When looking into performance issues in the kernel, perf top is a good place to start. It gives a constantly updating kernel profile:
# perf top

We are spending over 70% of total time in _spin_lock, so we definitely have an issue that warrants further investigation. To get a more detailed view we can use the perf record tool. The -g option records backtraces which allows us to look at the call graphs responsible for the performance issue:
# perf record -g ./pagefault
You can either let the profiled application run to completion, or since this microbenchmark will run forever we can just wait 10 seconds and hit ctrl-c. Two more perf record options you will find useful, is -p to profile a running process and -a to profile the entire system.
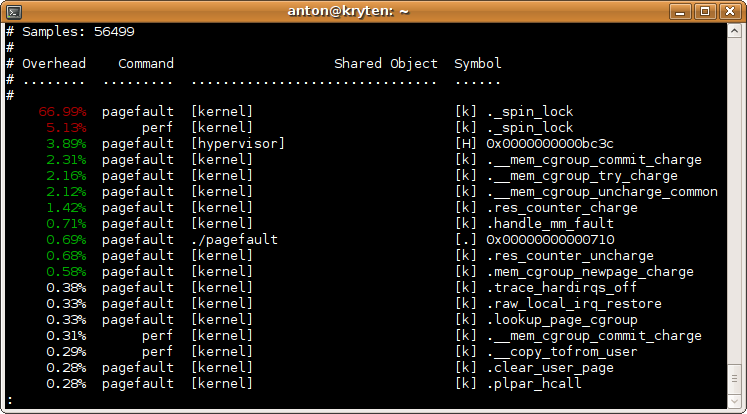
Now we have a perf.data output file. I like to start with a high level summary of the recorded data first:
# perf report -g none

The perf report tool gives us some more important information that perf top does not – it shows the task associated with the function and it also profiles userspace.
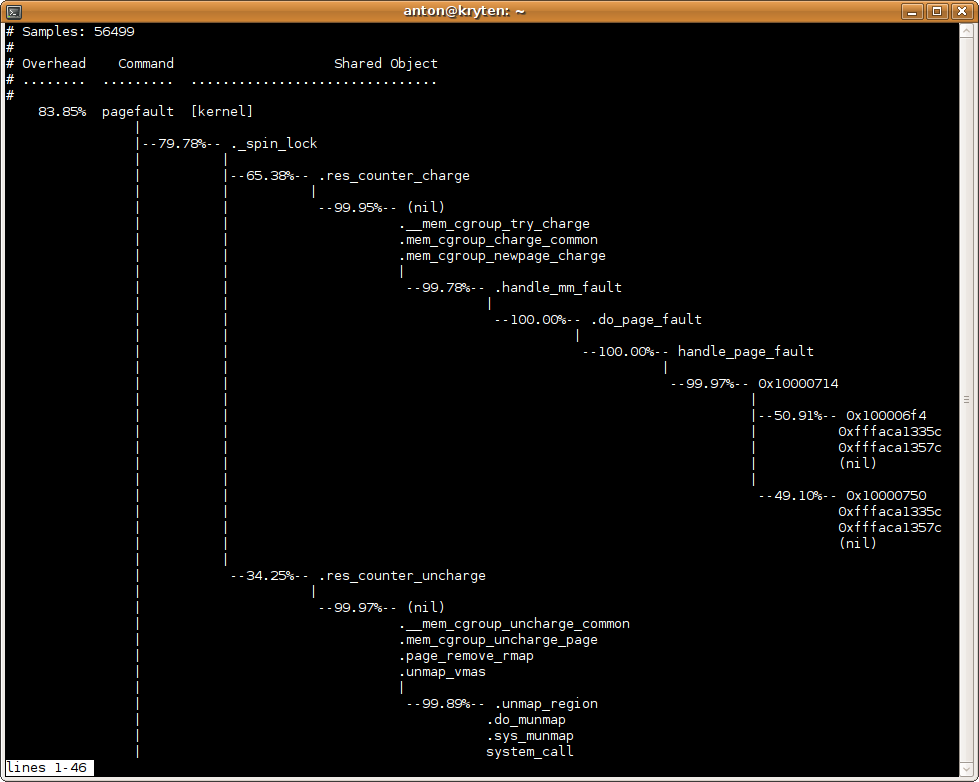
Now we have confirmed that our trace has captured the _spin_lock issue, we can look at the call graph data to see what path is causing the problem:
# perf report

At this point its clear that the problem is a spin lock in the memory cgroup code. In order to keep accurate memory usage statistics, the current code uses a global spinlock. One way we can fix this is to use percpu_counters, which Balbir has been working on here.
