Fuzzing on POWER Linux with AFL

Fuzzing has got a lot of attention lately and if you write C or C++ code and haven’t thought about fuzzing, you really should. It’s common to find dozens of bugs when first applying it to a project.

To get familiar with the latest in fuzzing, I decided to fuzz DTC, our tool for manipulating flattened device trees. Fuzzing is very effective at testing tools that take input from files, so DTC fits the bill. For other projects, you can either build a test harness that takes file input or use the LLVM fuzzing library.

As for the tool, I chose American Fuzzy Lop (AFL). AFL is a fuzzer that is both powerful and easy to use—you can be up and running in minutes. It instruments the code and uses that feedback in order to discover new significant test cases. It also comes with an LLVM plugin which works well on POWER Linux.

Here are the steps I took to fuzz DTC. I’m starting from a ppc64le Ubuntu 15.10 Docker image, so the first step is to install some required packages:

apt-get install build-essential wget git llvm clang flex bison

Now download and build AFL, including the LLVM plugin:

mkdir -p $HOME/afl
cd $HOME/afl
wget -N http://lcamtuf.coredump.cx/afl/releases/afl-latest.tgz
tar xzf afl-latest.tgz --strip-components=1
make AFL_NOX86=1
cd llvm_mode
make
cd ../

Download and build DTC using the LLVM plugin:

git clone git://git.kernel.org/pub/scm/utils/dtc/dtc.git
cd dtc
make CC=$HOME/afl/afl-clang-fast

Create an input and output directory, and seed the input directory. I just chose one of the DTC test cases for this. These will be mutated to produce new test cases. You can add as many as you want but keep them reasonably small:

mkdir -p in out
cp tests/fdtdump.dts in

Run it!

$HOME/afl/afl-fuzz -i in -o out -- ./dtc -I dts @@

Notice how @@ is used to specify the name of the input file to be tested. AFL will feed the file to STDIN otherwise.

That simple setup has found quite a number of bugs. Thanks to David Gibson, the maintainer of DTC, for fixing them all!

AFL also produces a very useful test corpus in out/queue which you can use for more heavyweight testing, eg valgrind or the LLVM sanitizers.

 

Swift on POWER Linux

Apple open sourced the Swift language recently, and I’ve been meaning to take a look at how much work it would be to port it to POWER Linux.

As with many languages that use LLVM, it turned out to be relatively straightforward. I submitted a patch a few days ago, and thanks to some great assistance from Dmitri Gribenko in reviewing my work, support for little endian PowerPC64 is already upstream.

A couple of things made the port go smoothly. Firstly the compiler is written in C++ and not Swift. It seems rewrite the Swift compiler in Swift is a common request, but sticking to C++ makes the bootstrap process so much easier. I’ve had to bootstrap other compilers (Rust) that are written in their target language, and that requires a cross build from a supported architecture which never goes smoothly.

More often than not, languages need to link to C objects and libraries, so they need knowledge of the C calling convention rules. Much of this knowledge is not in LLVM (it’s in the Clang frontend), and as a result most LLVM based languages end up duplicating it (Rust, Julia). Uli Weigand pointed out to me that Swift pulls in Clang to provide this, which really helps. With all the duplication across languages, it might make sense to move this logic into an LLVM library instead of Clang.

Even though the port is upstream, there is one required LLVM change here – Swift has some calling conventions that are different to C, and I’m hoping one of the POWER LLVM team will take pity on me and sort it out.

Building Swift on POWER is straightforward on Ubuntu 15.10, just remember to add the LLVM patch above after checking out the source.

The testsuite runs with only a couple of failures:

Failing Tests (2):
    Swift :: 1_stdlib/VarArgs.swift
    Swift :: IRGen/c_layout.sil

  Expected Passes    : 7061
  Expected Failures  : 78
  Unsupported Tests  : 699
  Unexpected Failures: 2

And more importantly, hello world works:

# uname -m
ppc64le

# cat hello.swift
print("Hello, world!")

# swift hello.swift
Hello, world!

There is still work to be done to get big endian PowerPC64 going, but little endian seems solid for any of your hello world needs.


Using perf, the Linux Performance Analysis tool on Ubuntu Karmic

A lot has been going on with Linux performance counters (now called performance events), but there is enough functionality in the 2.6.31 kernel that ships with Ubuntu karmic to be able to use some of the features available in perf. I recently found it useful when debugging a performance issue on my mythtv frontend.

To build perf, first install the dependencies:

sudo apt-get install libelf-dev binutils-dev

Then grab a recent kernel source tree and build perf:

wget http://www.kernel.org/pub/linux/kernel/v2.6/testing/linux-2.6.33-rc3.tar.bz2
tar xjf linux-2.6.33-rc3.tar.bz2
cd linux-2.6.33-rc3/tools/perf
make
make install

It will warn that libdwarf-dev is not installed, but the version in karmic is too old and regardless libdwarf is only required for event tracing that appeared in more recent kernels. perf installs into ~/bin/perf. You should then be able to use the top, stat, list, record, report and annotate options.

Linux Static Tracepoints

Linux has had dynamic trace functionality for a long time in the form of kprobes. Kprobes provides a kernel API for placing probes on kernel instructions and they can be exploited directly via a kernel module, or via systemtap which provides a high level scripting language. Dynamic tracing has a number of advantages – it has zero overhead when disabled and probes can be placed on almost any instruction in the kernel, not just where a kernel developer thinks you should.

All this flexibility does have some downsides. An executed kprobe has a significant overhead since it uses breakpoints and exception handlers. Having said that, there are patches that avoid the breakpoint and instead branch directly to the handler. Another issue is probe placement; kprobes are easily placed at function entry and exit but if you need to probe inside a function or probe local variables then you really need systemtap and a kernel compiled with CONFIG_DEBUG_INFO. On the other hand a static tracepoint can be placed anywhere in a function and can be passed any important local variables. Various static tracepoint patches have been available for Linux, but as of 2.6.32 a complete implementation is in mainline.

Adding a static tracepoint is very simple, an example can be found here. In this case I am adding to an existing trace group (irq), so I only need the tracepoint definitions and the tracepoints themselves. An explanation of the 5 parts of a tracepoint definition can be found in linux/samples/trace_events/trace-events-sample.h. For more complicated scenarios, refer to the files in linux/samples/trace_events/

Using static tracepoints

There are only a few steps to make use of static tracepoints. First ensure that debugfs is mounted. Most distros mount it on /sys/kernel/debug:

# mount | grep debugfs

debugfs on /sys/kernel/debug type debugfs (rw)

A list of available tracepoints can be found in tracing/available_events:

# cat /sys/kernel/debug/tracing/available_events

skb:skb_copy_datagram_iovec
skb:kfree_skb
block:block_rq_remap
block:block_remap
block:block_split
block:block_unplug_io
block:block_unplug_timer
...

Since we added our tracepoints to the irq group, we can find them in tracing/events/irq:

# ls /sys/kernel/debug/tracing/events/irq/

enable  irq_handler_entry  softirq_entry  tasklet_entry
filter  irq_handler_exit   softirq_exit   tasklet_exit

Enable the tasklet tracepoints:

# echo 1 >  /sys/kernel/debug/tracing/events/irq/tasklet_entry/enable
# echo 1 >  /sys/kernel/debug/tracing/events/irq/tasklet_exit/enable

And the output is available in the trace buffer:

# cat /sys/kernel/debug/tracing/trace

# tracer: nop
#
#           TASK-PID    CPU#    TIMESTAMP  FUNCTION
#              | |       |          |         |
-0     [000]   327.349213: tasklet_entry: func=.rpavscsi_task
-0     [000]   327.349217: tasklet_exit: func=.rpavscsi_task

When finished, we can disable the tracepoints. There are enable files at all levels of the hierarchy, so we can disable all tracepoints in one go:

# echo 0 > /sys/kernel/debug/tracing/events/enable

Using static tracepoints in kernel modules

Kernel modules can also make use of static tracepoints. A simple module that hooks the tasklet_entry tracepoint and printks the function name of the tasklet might look like (I’ve called it tracepoint-example.c):

#include <linux/module.h>
#include <trace/events/irq.h>

static void probe_tasklet_entry(struct tasklet_struct *t)
{
        printk("tasklet_entry %pf\n", t->func);
}

static int __init trace_init(void)
{
        WARN_ON(register_trace_tasklet_entry(probe_tasklet_entry));
        return 0;
}

static void __exit trace_exit(void)
{
        unregister_trace_tasklet_entry(probe_tasklet_entry);
}

module_init(trace_init)
module_exit(trace_exit)
MODULE_LICENSE("GPL");

If you are wondering, %pf is a printk formatter trick to pretty print a function name so you don’t have to go searching for the address in System.map.

Here is a Makefile to go with it:

obj-m := tracepoint-example.o
KDIR := /lib/modules/$(shell uname -r)/build
PWD := $(shell pwd)
default:
        $(MAKE) -C $(KDIR) SUBDIRS=$(PWD) modules

Using Performance Counters for Linux

The 2.6.31 Linux kernel will add a new performance counter subsystem called Performance Counters for Linux (or perfcounters for short). To use perfcounters, build a kernel with:

CONFIG_PERF_COUNTERS=y

You will need elfutils and optionally binutils (for c++ function unmangling). On debian or ubuntu:

apt-get install libelf-dev binutils-dev

The tools must be built 64bit on a 64bit kernel. If you have a mixed 64bit kernel/32bit userspace (like some amd64 and ppc64 distros) then build a 64bit version of elfutils. I usually don’t bother building the optional 64bit binutils in this case and just put up with mangled c++ names (hint: feed them into c++filt to demangle them). Now build the perf tool:

# cd tools/perf
# make

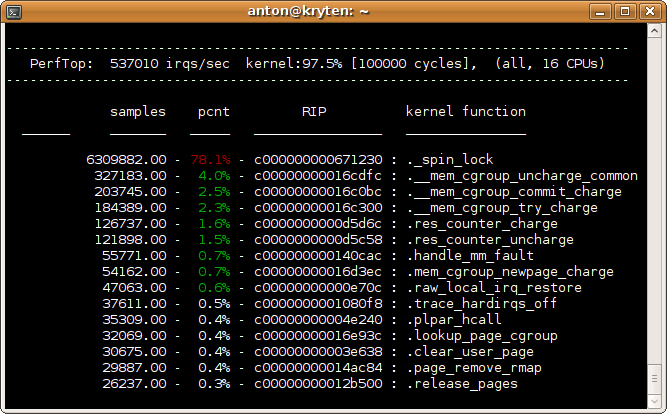
Now we can use the tools to debug a performance issue I was seeing in 2.6.31. A simple page fault microbenchmark was showing scalability issues when running multiple copies at once. When looking into performance issues in the kernel, perf top is a good place to start. It gives a constantly updating kernel profile:

# perf top

perf top output

We are spending over 70% of total time in _spin_lock, so we definitely have an issue that warrants further investigation. To get a more detailed view we can use the perf record tool. The -g option records backtraces which allows us to look at the call graphs responsible for the performance issue:

# perf record -g ./pagefault

You can either let the profiled application run to completion, or since this microbenchmark will run forever we can just wait 10 seconds and hit ctrl-c. Two more perf record options you will find useful, is -p to profile a running process and -a to profile the entire system.

Now we have a perf.data output file. I like to start with a high level summary of the recorded data first:

# perf report -g none

perf report

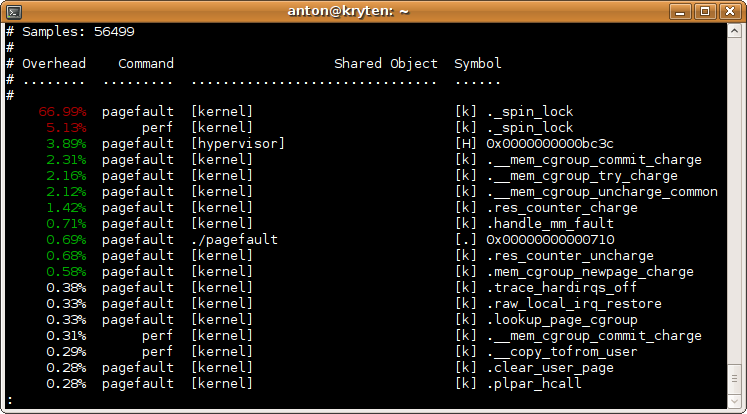
The perf report tool gives us some more important information that perf top does not – it shows the task associated with the function and it also profiles userspace.

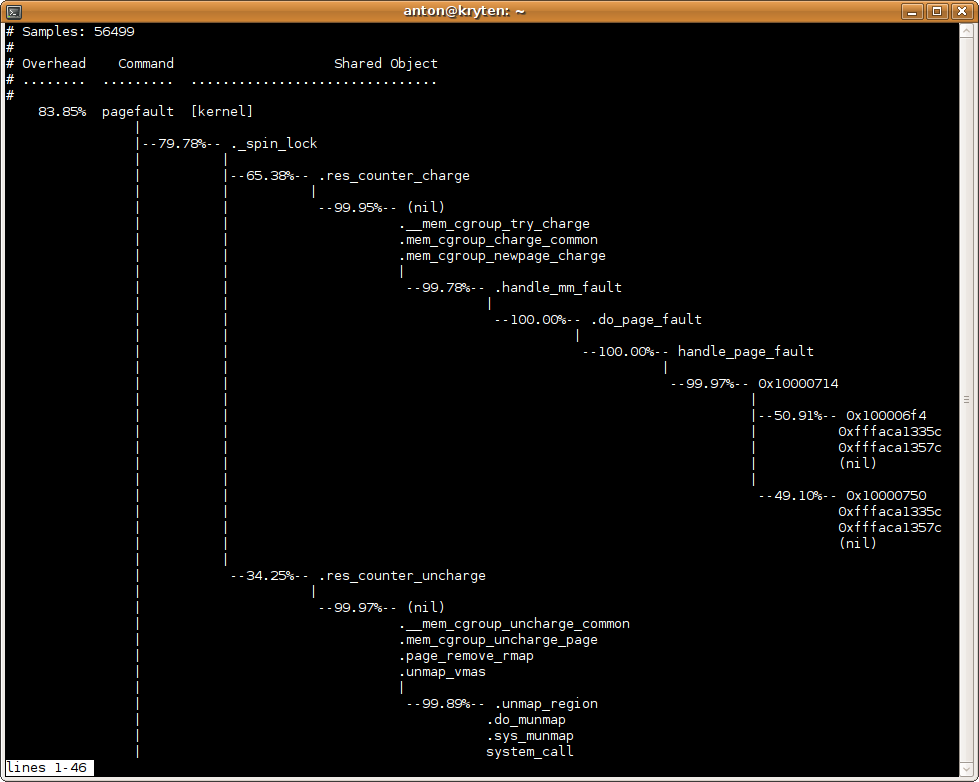
Now we have confirmed that our trace has captured the _spin_lock issue, we can look at the call graph data to see what path is causing the problem:

# perf report

perf_report_callgraph

At this point its clear that the problem is a spin lock in the memory cgroup code. In order to keep accurate memory usage statistics, the current code uses a global spinlock. One way we can fix this is to use percpu_counters, which Balbir has been working on here.

Booting Linux faster with parallel probing

On machines with large numbers of SCSI adapters and disks a significant amount of time can be spent probing for disks. By default Linux probes disks serially, but there are options to parallelise this.

The two phases of disk probe that can be parallelised are:

  1. Adapter probe. This is where each adapter is probed, reset and allowed to settle. This can be parallelised with the “scsi_mod.scan=async” boot option.
  2. Disk probe. This is where each disk behind an adapter is probed. The disk is spun up if it isn’t already spinning. This can be parallelised with the “fastboot” boot option.

To highlight the importance of parallelising both parts of disk probe, I ran three tests and measured the time it took to get to userspace. I used a POWER5 system with 4 SCSI controllers and 13 disks as a benchmark system. The disks were not spinning when Linux was booted.

  • Serial adapter and disk probe: 88 seconds
  • Parallel adapter probe, serial disk probe: 67 seconds
  • Parallel adapter and disk probe: 15 seconds

On this system, full parallelisation is over 5 times faster.